
Appearance
Reports & History
Everything your account has recorded — registrations, payments, completions, evaluation responses — is queryable here and exports to a spreadsheet. This is where you go for an audit, a reaccreditation submission, or a question that spans more than one course.
Find these under Organization Settings → Reports & History.
| Report | Answers |
|---|---|
| Account Activity | How are sign-ups, revenue, and completions trending — and how fast am I using participants? |
| Transcripts | What did people score on quizzes in this period? |
| Global Participant Search | What has this one person taken with us? |
| Payment History | What did registrants pay us? |
| Credit Reporting History | What credit was claimed, and did it reach the accrediting body? |
| Question Fingerprint Report | How do people answer this evaluation question across my catalog? |
| Activity Report | What does my whole credit catalog look like, in one spreadsheet? |
Looking for invoices?
Your orders, receipts, and invoice PDFs are on the Subscription & Billing page.
Account Activity
Sign-ups, revenue, and completions across your whole account, charted over time.
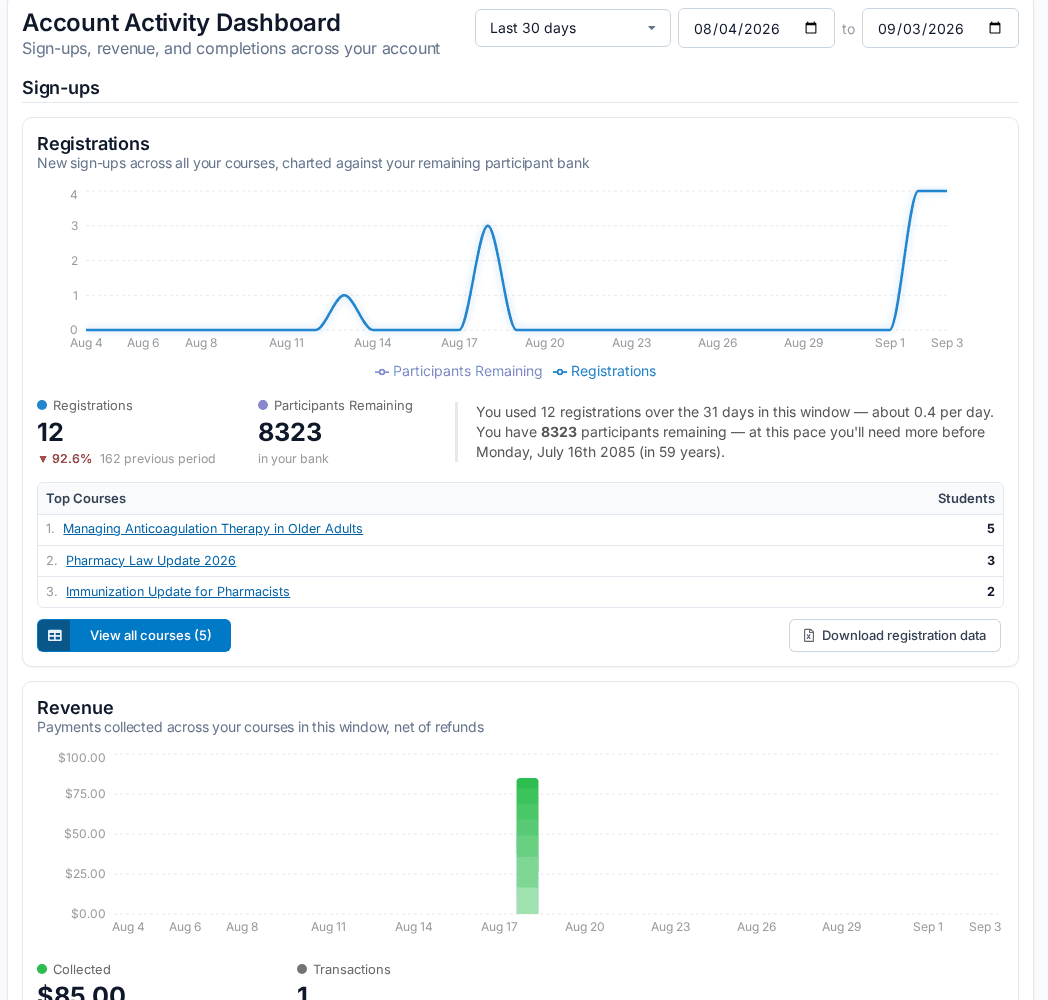
Four cards, each with a trend chart, headline numbers, and a comparison against the previous period of the same length:
- Registrations — New sign-ups across all your courses, charted against your remaining Participant Bank, with a projection of when you'll need more participants at your current pace.
- Revenue — Payments collected across your courses, net of refunds, along with the number of transactions. This card requires the ORG ADMIN or PAYMENT PROCESSORS permission — without it the rest of the dashboard still works.
- Registration Types — How the window's sign-ups divide across your registration types. View all courses opens a course-by-type breakdown table.
- Credits & Completions — Credits awarded to learners and courses fully completed, with the top courses for each.
Pick a window from the dropdown (Month to date, Previous month, Last 30 days, …) — it fills in the two date fields — or edit the dates directly for any custom range. The download buttons export the underlying rows to Excel: registration data, the credit report, and the by-course tables.
Use the projection before you set your refill threshold
The Registrations card projects when your Participant Bank runs out at your current pace — that projection is what makes a sensible Low Participant Threshold.
This replaces Usage History
The old Usage History page is retired, and its old address brings you here. The bank-over-time chart now lives on the Registrations card. Your course list also shows each course's all-time student count (and revenue, for courses with pricing) drawn from the same data.
Transcripts
A global report of all the quiz grades within a certain timeframe.
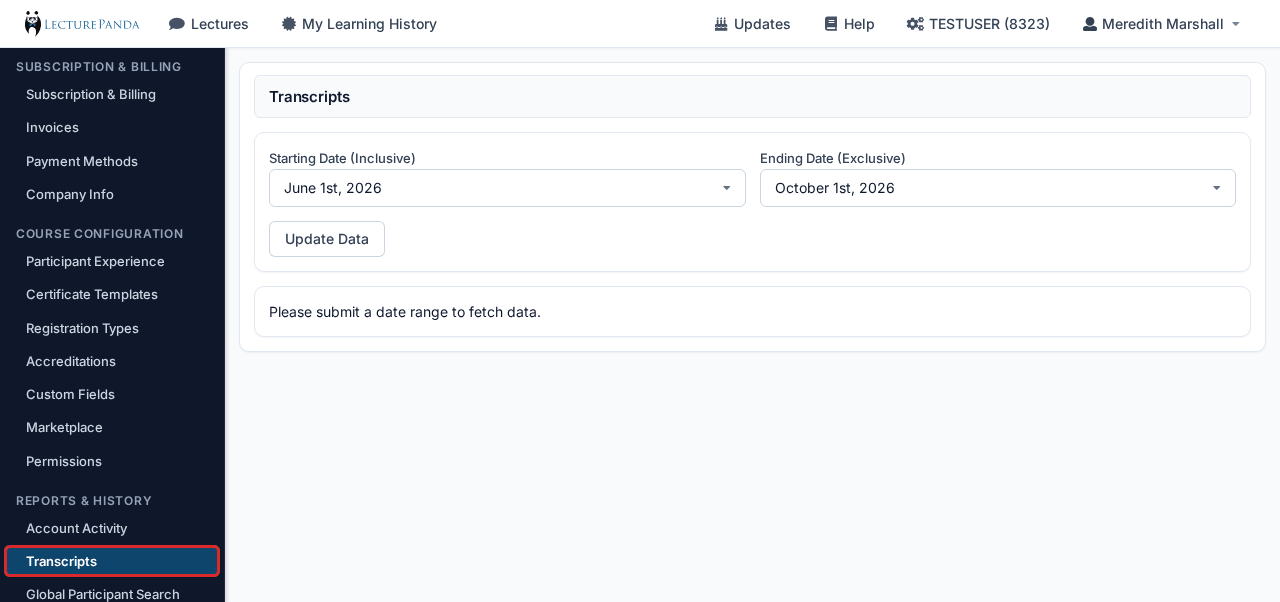
Set a date range, click Update Data, then Download Data. This report has no on-screen table — it builds a spreadsheet of every quiz grade in the period and hands it to you.
Wide ranges take a while
The report gathers lectures, registration types, registrations, quizzes, and responses in turn, and tells you which stage it is on while it works. A multi-year range is slow rather than stuck.
Global Participant Search
Search for a specific participant and view all event information attached to that individual.
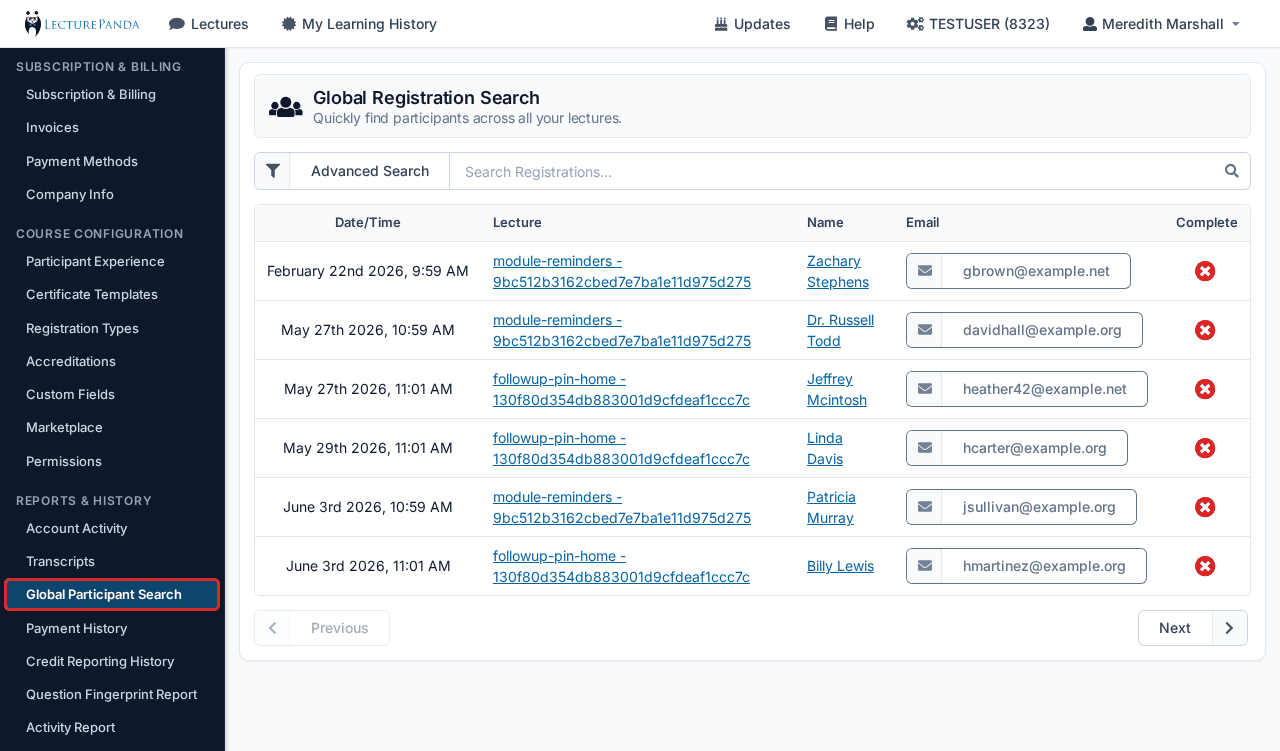
This is the tool for "what has this member taken with us?" — it finds the person and shows everything attached to them across the whole account, not just one course. See Finding a Learner for the wider set of options.
Payment History
View all participant payment history information.
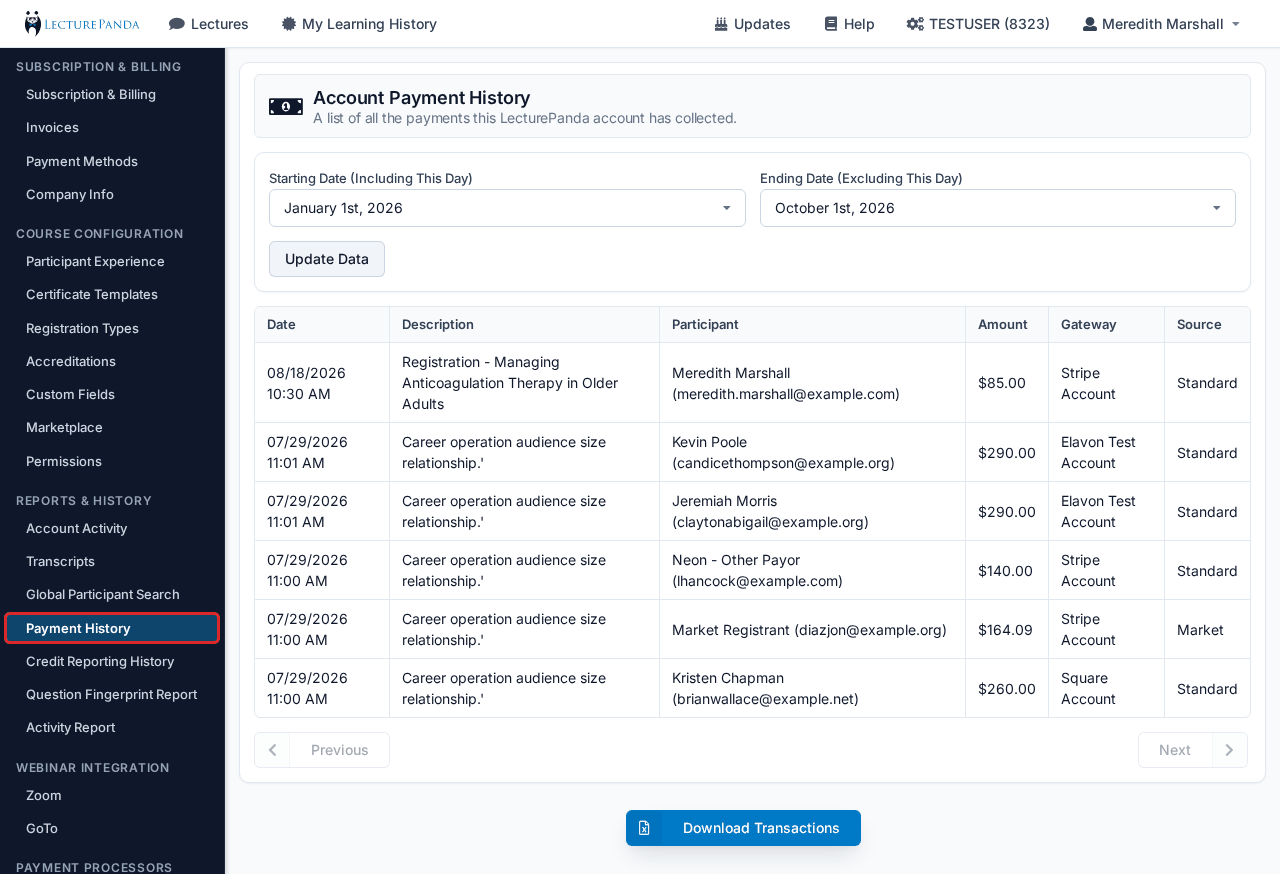
This is money from registrants, not money you paid us
Payments your learners made for registrations are here. What you paid LecturePanda is on Subscription & Billing.
Credit Reporting History
Review credit completion and reporting history for all courses.
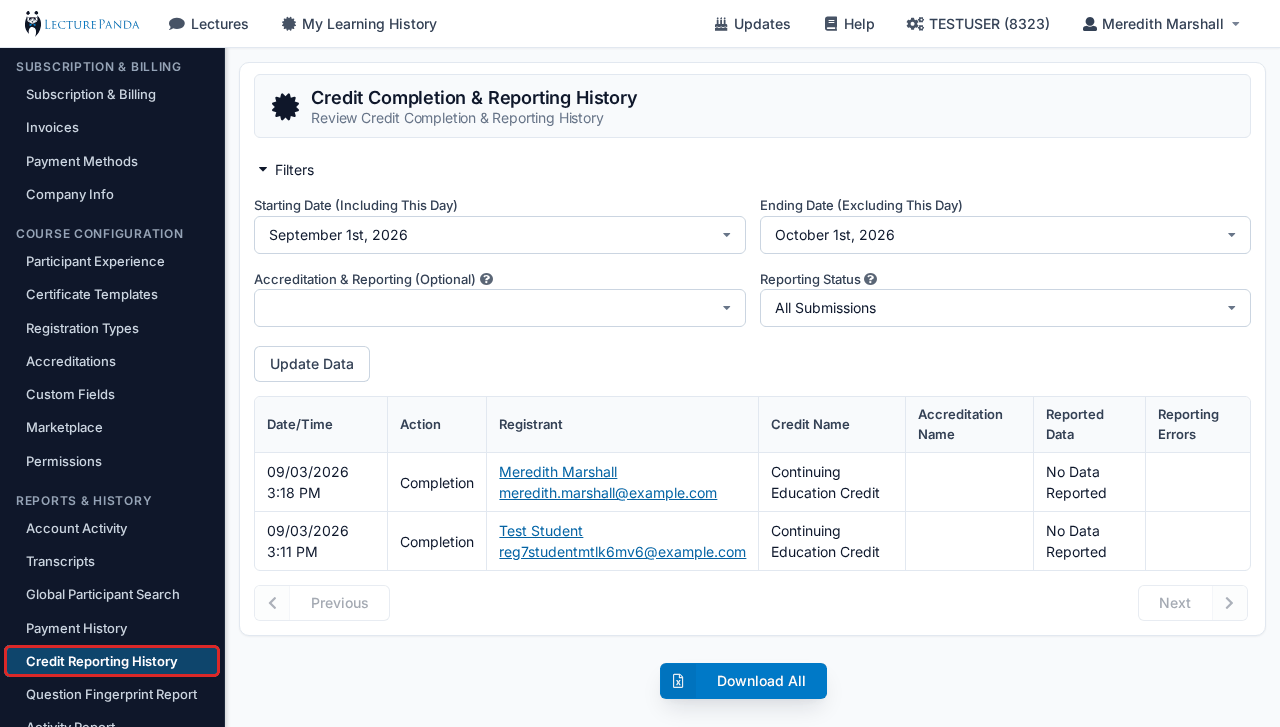
| Detail Name | Description |
|---|---|
| Starting/Ending Date | The timeframe for the data. |
| Accreditation & Reporting (Optional) | Optionally restrict results to one accreditation/reporting option configured on the Accreditations page. |
| Reporting Status | Errors only, successful submissions only, or all submissions. |
Totalling credit hours for an audit
Use Download All to export the reported credits for your date range, then total them in a spreadsheet. The export is registrant-level — one row per participant completion — which matters for how you add it up:
- Total credit-hours awarded (every completion counted): sum the Hours column directly.
- Unique hours offered (each activity counted once): because every completion of the same activity repeats its hours, total it per activity instead. In a pivot table, use the activity identifier as the row, Hours as the value, and change Summarize Values By from Sum to Max — the grand total then adds one value per activity. Or copy the identifier and Hours columns to a blank sheet, remove duplicates, and sum what's left.
For ACPE credits
The UAN is your activity identifier, so use it as the pivot row above. It also splits your catalog by format: home-study activities carry an H in the UAN, live activities an L.
A wide date range takes a few minutes
A multi-year export that looks like it's spinning is usually still generating rather than stuck. Give it a few minutes, or pull one year at a time.
Question Fingerprint Report
Analyze survey responses to identical questions across all your courses.
This report aggregates responses by question rather than by course, so the same evaluation question asked in thirty courses becomes one line with thirty courses' worth of answers behind it. That makes it the practical way to spot satisfaction trends and to compile evaluation data for reaccreditation.
Filtering your report
| Option | Description |
|---|---|
| Date Range | Starting and ending dates. Defaults to the last 30 days. |
| Quiz Type | Survey Only, Quiz Only (Graded), or All Types. Defaults to surveys. |
| Quiz Phase | Pre-Learning, Audience Polling, Post-Learning, 3-Month Follow Up, 6-Month Follow Up, or 12-Month Follow Up. Defaults to Post-Learning. |
Click the blue Fetch Data button to build the report.
Using your report
Once data is fetched you get each unique question shown once with its responses aggregated, charts of the response data, and totals for how many people answered.
Printing and exporting
The purple Print Report button produces a formatted document — your organization name, the report title, date range, generation timestamp, and all the charts, with the form controls hidden. That is generally what a reaccreditation submission is asking for, ACPE's among them.
The blue Download Data button exports the same data as an Excel spreadsheet for your own analysis.
Reuse your evaluation questions deliberately
This report groups by the question itself, so asking the same wording across courses is what makes the trend visible. Varying the wording splits one trend into several.
Activity Report
Download an Excel spreadsheet listing every credit offering across your activities.
This is your credit catalog as a spreadsheet — one row per credit, so a lecture carrying three credits produces three rows. Archived credits are included, which is the point: it is built for annual reporting and program inventories, where the things you retired during the year still have to be accounted for.
Choosing a range
Set Start Date and End Date — these filter on when the activity begins — or use one of the presets: Last 12 months (the default), Last 90 days, Previous calendar year, or All time.
Click Download Activity Report. The file is named for the range you picked, and you get a count of the rows exported.
What's in the file
| Group | Columns |
|---|---|
| Activity | Activity Title, Start Date/Time, End Date/Time, Timezone, Lecture Setting, Lecture Active |
| Credit | Credit Name, Credit Type, CE Hours, External ID (UAN), Credit Active |
| ACPE | ACPE Activity Type, ACPE Course Setting, ACPE Format, ACPE Live Date, ACPE Release Date, ACPE Expiration Date, ACPE CEUs |
| PARS | PARS Activity ID |
| Providers | Which accreditation each credit reports to, with the provider ID |
For ACPE annual reporting
Pull Previous calendar year, then filter in Excel. The ACPE columns carry the live, release, and expiration dates and the CEU value for each credit, so the report can usually be filtered into shape without going back into individual courses.
Activities versus completions
This report describes what you offered. For what learners actually claimed, use Credit Reporting History.